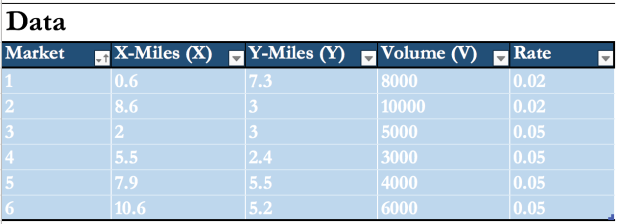
Imagine yourself as an employee for a very prestigious firm. This firm has a large domestic presence, and your boss asks you to help find the best location to implement their new manufacturing facility. You don’t know where to start, and your company lacks necessary resources to automate the process of finding the best location. Without further explanation, your boss hands you data he has gathered, gives you a pat on the back, and he leaves you to it. Here is an oversimplified version of the data-set he provides:
I know, the raw data seems confusing at first. But with proper expertise, you can provide a logical solution for your boss. This solution will explain the optimal location to place your facility relative to the markets surrounding it. Before digging into the process of finding the coordinates for your new facility, however, I would like to take time to describe the strategic importance in location of a firm’s facilities.
The Importance of Location StrategyOne of the most important projects you may take on as a business owner, or employee, could deal with locating the best position for your facilities. Location strategy can strengthen a supply chain network or leave it cascading into an endless cycle of unnecessary expense. Though these location decisions are made relatively infrequent, it is important to understand location has a significant impact on a companies fixed and variable costs. This phenomena demonstrates to us why location decisions are exceedingly important to companies.
Cost of transportation, shipping, labor, and many other expenses must be taken into account. These costs are why you hope to make a long-term decision when finding that “optimal” location for your firm’s facilities. The reason being, when you commit to a location your cost issues are difficult to change. In addition, a number of challenges may be present when implementing a location strategy for your firm.
For starters, the number of facilities a firm may require to operate effectively can either be influenced within the company (endogenous) or by some outside force (exogenous). This makes it hard to plan a rigid location strategy. The possibility of facility relocation is an incessant problem, resulting in higher expenses. The second inherent problem lies within the location. The need for the best facility location, among growing firms in any industry, is a continuous process. This poses a problem because the purpose of each facility is relatively discrete. There is only one optimal location, so when planning for multiple facilities, it is tedious trying to find the best location for each facility. It is difficult finding a location that provides the necessities to fulfill its purpose in a cost effective manner, relative to the market.
Understand Your Companies ObjectivesThe last problem is easily solved through means of communication. Frequent communication nurtures a transparent environment, which is important for every company. Transparency of a companies objectives from top management down is a prerequisite to a strong location strategy. It is important for you to understand your companies objectives when determining a location for your facility. Do they promote cost effectiveness, service level, or maybe quality? Regardless the objective, your location strategy depends on it. This becomes a problem for companies because they forget to clearly define their objectives before deciding where to locate their facilities.
If your company encourages cost effectiveness, placing a manufacturing or warehousing plant in a large city may be a decision you will regret. In this case your fixed costs would increase. Finding a location in less populated Midwestern cities might be a better option. Here costs are relatively lower. Variable costs may slightly increase with the distance from market, but any fixed cost your facility may incur will likely lower.
The trade-off between costs, however, should not be taken lightly. It will be important, before making a decision, to determine which region is more cost effective. On the other hand, if your company promotes service level, you may want to locate your facility closer to the market or markets your company sells to. This will allow more time for your facility to ship a quality product to its destination in a timely manner. Quality and on-time delivery reflects high service level. The relationship between the cost of transportation relative to the supplier location and market can be better defined by former president Herbert Hoover.
In 1957, Hoover developed a model known as the Tapered Transportation Rates. In summary this model demonstrates that any costs associated with transportation are lowest at the source of material. In other words, transportation costs decrease the closer you are in distance to the market. The problem with this model: (1) rarely does a manufacturing company source one raw material. Today, they use many sources that provide components to make a finished product. (2) In addition to this, it is rare for a company to be involved in one single market. Regardless the models modern validity, the takeaway is to understand your companies objectives and let that guide your location strategy.
Step 1: Solving For the Optimal LocationThe method that will be used to decide the location for our new facility is called the Center of Gravity. In short, this method finds a location for your facility that best minimizes distribution costs. It is important to note, this method is best at finding a single location. The logic behind the center of gravity, simple grid method (Heuristic) is as follows:
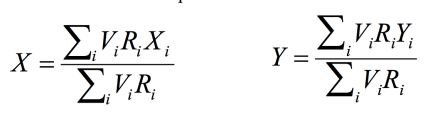
These equations take into consideration:
- The location of markets (Xi,Yi): When referring to the data table provided in the example (at the top of the page) these locations can be found in columns X-Miles (X), Y-Miles (Y). If you plan on solving this problem by hand, it is important to plug the Xi values in the X intercept equation on the left, and the Yi values in the Y intercept equation on the right.
- Vi: This value equals the volume of goods shipped to the associated market. Volume can be found in the Volume (V) column at the top of this page.
- Ri: This value is the equivalent of the shipping cost (or distance). Rate can be found in the Rate column in the first example.
Here is an example of the process, by hand, using the data from the table above:
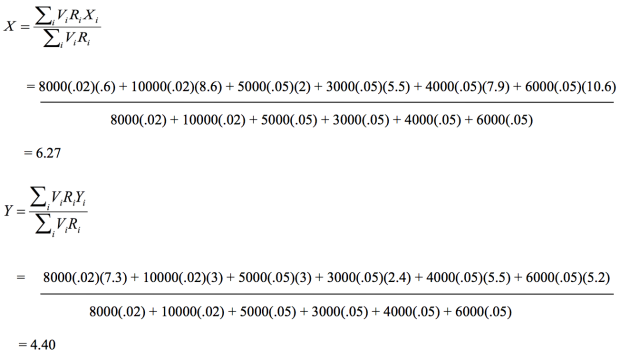
Optimal Facility Location Coordinates for Graph: (6.27,4.4o)
When plugging the values, from the data-set, into these equations you should see a process similar to the one up above.
Step 2: Solving For Total CostAfter finding the coordinates for the optimal location of your new facility, you can then use those two values to calculate the total distribution cost. Remember, the objective was to find a location that would minimize the total cost. Given all other values, (6.27, 4.40) logically are the optimal values; furthermore, the equation for total cost is as follows:

The new values these equations consider:
- di: This constant equals the distance from the given market to the optimal facility location.
- X: The X-value equals the optimal X coordinate found in the above example. (6.27)
- Y: The Y-value equals the optimal Y coordinate found in the above example. (4.40)
The process for solving the total cost by hand is rather tedious so I created a spreadsheet in Excel that automated the process. See for yourself.
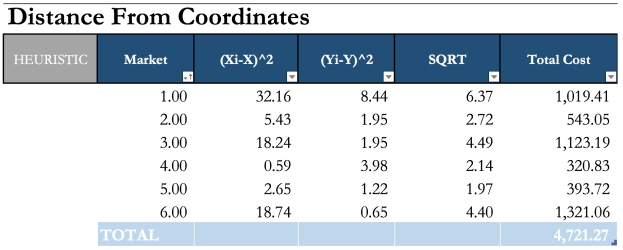
By using Excel, I turned a four minute problem into a thirty second triumph. As you can see in the table, each column reflects a specific process that would need to be followed by hand otherwise. To make this table work all you have to do is insert the data personally gathered or provided by your employer.
The Excel file, attached below, was created by me to more efficiently solve the center of gravity method. It consists of three sheets, each of which have their own separate instructions. The first sheet consists of a data table. To start the process you will need to insert your data into this table. From their, you will proceed to the next sheet. This sheet will organize your data into a pivot table. Once organized, the Calculations table will do all the necessary calculations to find the best location for your facility. The optimal coordinates can be found to the far right of the sheet. The last sheet has one table that automatically calculates the total distribution cost. This process can be seen in the picture above. There doesn’t have to be much cell manipulation to gather the total cost.
I firmly believe Excel can save you a lot of time when solving for the center of gravity. Because of this, I have provided my personal workbook that I use for Location strategy. (It is still a work in-progress) I have also left the equations visible, so if you decide you want to create a tool using the center of gravity method you can reference to my workbook. Who knows, maybe your can come up with a more efficient tool than mine. Whatever your intent for viewing my workbook is, just click on the link below to download it.
Center of Gravity Calculator
Center of Gravity Vs. Other Common MethodsWhen it comes to locating the best place for your facility, there are multiple logistical methods to choose from. Some of these options are better than the method I demonstrated, however, they may be more time consuming. The other common methods companies use include: K-median, branch clipping, K-center, set covering, and dynamic facility location. Each method fulfills it’s own unique purpose, however, center of gravity is the only method I am exploiting today.
In hindsight, it is important to note the center of gravity has a setback. The main problem regards the few assumptions built into the logic. (1) the method does not take into account addition variables like manufacturing costs. (2) It can also be very tedious trying to retrieve grid coordinates if there are many locations. (3) This method works poorly with countries on different continents. Meaning, the ideal location you may be searching for could be in the middle of the ocean.
Given these set-backs, the center of gravity still has its uses. For example, Leaseway, a Michigan stationed trucking company uses this method to locate maintenance facilities in Boston. Oil companies, additionally, use this method to locate ideal platforms for oil collection in the Gulf of Mexico. Taking into account everything discussed, this method is a great starting point for making decisions relevant to supply chain design.
Why to Use Excel For Location StrategyBefore ending my personal insight on location strategy, I would like to list a select few reasons why I use Excel to solve relevant location problems.
- More