An initial estimate of the possible number of categories in the 25% sample my nine-thousand-odd list of blog posts, provided by the Affinity Propagation (AP) algorithm, suggested over 100 categories. Based on the words used in the posts it chose to put into a cluster, this was actually reasonable although way more than I can process. It was also obvious that some of the categories could have been combined: maths- and science-based topics often appeared together, for example.
A different method provided by an algorithm in Orange (k-means, allowing the algorithm to find a ‘fit’ of between 2 and 30 clusters) suggested three or four clusters. How is it possible for algorithms, using the same data, to come up with such widely differing suggestions for clusters? Well, it’s maths. No doubt a mathematician could explain to me (and to you) in detail how the results were obtained, but for me all the explanation I need is that when you start converting words to numbers and use the results to decide which sets of numbers have greater similarity, you get a result that, while useful, completely disregards the nuances of language.
An initial attempt by me to review the content of the categories suggested by AP, but I had to give up after a few hours’ work. I identified a good number of potential categories, including the ones suggested by the literature (see below), but I soon realised that it was going to be difficult to attribute some posts to a specific category. A well-labelled training set is really important, even if it’s a small training set. So, back to the research that has already been published, describing he reasons why teachers and other edu-professionals blog, and a chat with my supervisor, who made the observation that I needed to think about ‘process’ as opposed to ‘product’.
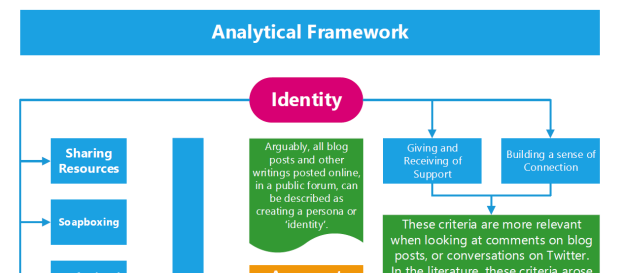
Bit of a lightbulb moment, then. I’m not trying to develop a searchable database of every topic covered – I’m trying to provide a summary of the most important aspects of teaching discussed in blogs over a period of time. The categories arising from the literature are clearly grounded in process, and so these are the ones I’ll use. If you click on this link, you’ll be able to see the full version of the Analytical Framework, a snippet of which is pictured above.
As well as the main categories (the ones in the blue boxes), I decided to add two more: ‘behaviour’ and ‘assessment / feedback / marking’ simply because these, in my judgement, are important enough topics to warrant categories of their own. However, I’m aware that they overlap with all the others, and so I may revise my decision in the light of results. What I’ll have to do is provide clear definitions of each category, linked with the terms associated with the relevant posts.
What will be interesting is exploring each category. The ‘concordance‘ widget in Orange allows for some of the key terms to be entered, and to see how they’re used in posts. This will add depth to the analysis, and may even lead to an additional category or two if it appears, for example, that ‘Ofsted’ dominated blogs within the ‘professional concern’ category for a considerable period of time, an additional category would be justified. My intention is to divide my data into sets by year (starting at 2004), although it may be prudent to sub-divide later years as the total number of blog posts increases year on year.
Advertisements Share this: