I listened to the Qualcomm Q3’2017 Financial Call on July 19th. Apple Inc. (AAPL) is allegedly instigating with its assemblers/suppliers to withhold both royalties and even contractually required unit sales reporting to Qualcomm. This makes modelling of current and future quarter royalties income virtually impossible. Qualcomm management believes it has the “high ground” under contract law. Unfortunately, legal battles take a long time to meander thru the US (and global) legal system. Lack of insight into forward earnings, as well as lack of a time line to a resolution has both analysts and the markets bearish. Sentiment is Strongly Bearish.
Surprisingly, lost in the dispute over licensing costs, it should be noted Apple Inc. has multiple revenue streams coming off the backs of Qualcomm’s IP, including non-SEP IP, which, apparently and allegedly, Apple Inc. is using, unlicensed, in Intel powered iPhones. Apple Inc.’s sales, besides the iPhones, of Apps, music, music videos, movie clips, movies, storage in the cloud …. and more are all dependant on Qualcomm’s IP. Isn’t Qualcomm’s IP MORE valuable to Apple Inc.’s revenue streams … than a Qualcomm customer that is just selling phones to call and text? Pretty sure that is a YES! I am also pretty sure, Apple Inc. doesn’t want jurors that can do math.
for more about Qualcomm (QCOM) see About Qualcomm (QCOM)
The Daily, Weekly, Monthly, (d-w-m) Qualcomm (Nasdaq: QCOM) chart analysis review below is a Bull/Bear, PROs, and CONs, buy–hold–sell–short chart analysis with the same capital conserving cautionary and pull back suggestions I have learned to appreciate and use to manage my investments with the RISK Reward Ratio. As I own shares of Qualcomm, I want to know the good, the bad, and the ugly, the buy–hold–sell–short because it’s my money. Occasionally, as in the Qualcomm chart analyses you’ll read below, the capital conserving cautionary and pull back suggestions can diverge from the sell–short tone to cautioning against price gains and rallies (highlighted in green) … that could/would be referred to as contrarian investing suggestions.
I hope sharing my homework helps you with yours.
- QCOM from Friday, (7/21/2017) 53.84 -0.13 (-0.24%)
- After Hours: $
- EPS(ttm): $2.61 P/E(ttm): 20.38
- 52 Week High: $71.62 52 Week Low: $51.05
- Index: NASDAQ 100® S&P 500®
Currently the Moving Average Convergence Divergence (MACD) for Qualcomm (QCOM) is bearish since it is trading below its signal line. The MACD crossed below its signal line 1 trading day ago. Since the MACD crossed below its moving average, Qualcomm’s price has decreased 0.24%, and has ranged from a low of 53.370 to a high of 55.43. The Qualcomm MACD is not in an Overbought/Oversold range. There have been no divergence signals within the last 5 trading days.
MACD Value: -0.349 Signal Line: -0.236
Friday’s (7/21/2017) Relative Strength Index (RSI) for Qualcomm was 36.632
See daily Pivot Points, Support, Resistance, etc. w/updates in:
- Qualcomm (QCOM) Daily Support and Resistance for July 2017
- Qualcomm (QCOM) Daily Support and Resistance for June 2017
- Qualcomm (QCOM) Daily Support and Resistance for May 2017
———————–
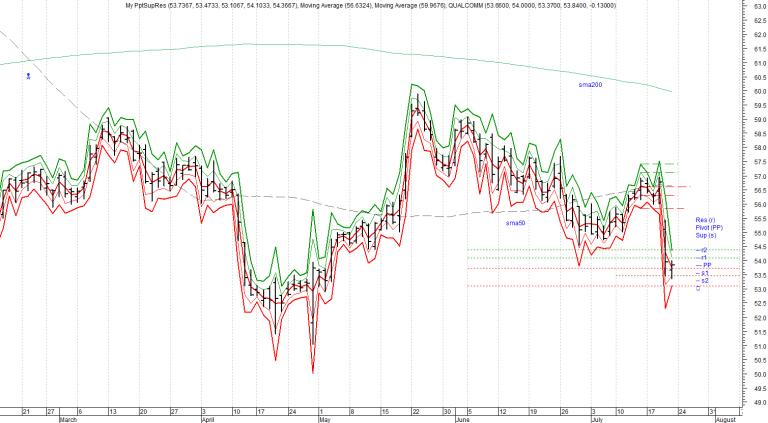
Chart 1: Qualcomm (QCOM), Daily, EOD, O-H-L-C w/Resistances (r2, r1), Pivot Point (PP), and Supports (s1, s2). Above DAILY chart thru Friday’s close 7/21/2017. Note: formation of “the Claw” in the above QCOM’s Daily chart … more homework needed (in progress!)
- ———————–
(1) Analysis of DAILY chart activity through Friday’s (7/21/2017) close at $53.84
The current trend is down and all orders on the short side may be considered. The current market price activity is Strongly Bearish and suggests favorable trade opportunities on the short side. If already holding short positions, we would look to take partial profits on any retracement to $56.94. Traders with remaining short positions, after profit taking, should consider placing capital conserving stops in the region of $56.94. Be prepared for a potential short term price rally back to the $56.08 area.
- Suggested placement of capital conserving stops:
- If Long, exit all contracts at: $53.37
- If Short, exit all contracts at: $56.94
(1.a) Additional DAILY chart info:
- Overall, the bias in prices is: Downwards.
- Short term: Prices are moving.
- Intermediate term: Prices are ranging.
- Note: this chart shows extraordinary price action to the downside.
(1.b) DAILY chart price projection ranges (7/24/2017 – 7/26/2017):
- Note (1.b.1) prices are vulnerable to a correction towards $56.12.
- The upper projected target is: $56.08.
- The lower projected target is: $51.54.
- The projected closing price is: $53.81.
- Note (1.b.2) the above DAILY chart price projection ranges are for reference only, and can be easily exceeded by Mr. & Ms. Fickle Markets.
- ———————–
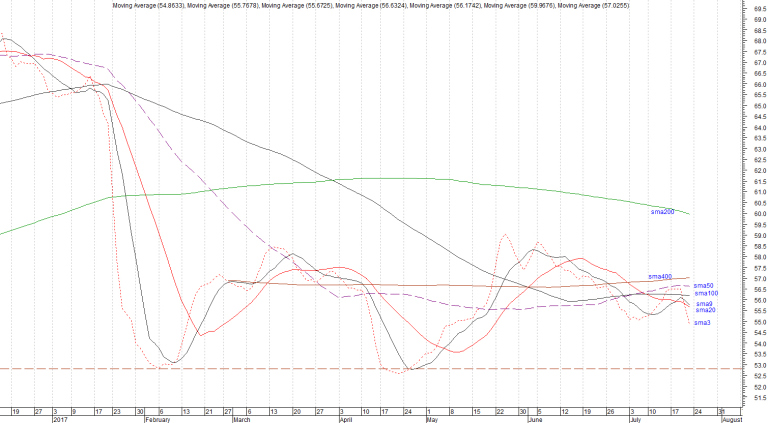
Chart 2: Qualcomm (QCOM), Daily, EOD Close, Simple Moving Averages: sma3, sma9, sma20, sma50, sma100, sma200, sma400 … looking for moving average trends and crossovers
- ———————–
(1.c) DAILY chart Moving Averages
- The 3 period Simple Moving Average (sma3) at 54.86 is in a down trend.
- The 9 period Simple Moving Average (sma9) at 55.77 is in a down trend.
- The 20 period Simple Moving Average (sma20) at 55.67 is in a down trend.
- The 50 period Simple Moving Average (sma50) at 56.63 is in a down trend.
- The 100 period Simple Moving Average (sma100) at 56.17 is in a down trend.
- The 200 period Simple Moving Average (sma200) at 59.97 is in a down trend.
- The 400 period Simple Moving Average (sma400) at 57.03 is in an up trend.
- ———————–
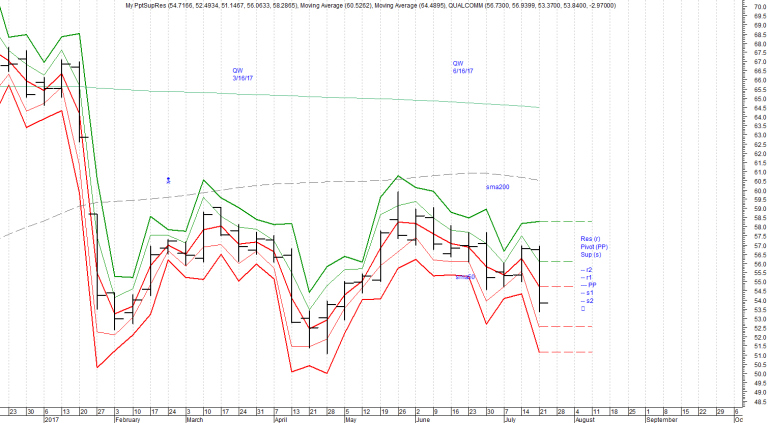
Chart 3: Qualcomm (QCOM), Weekly, EOD, O-H-L-C w/Resistances (r2, r1), Pivot Point (PP), and Supports (s1, s2).
- ———————–
(2) Analysis of WEEKLY chart activity through Friday’s (7/21/2017) close at $53.84
The current trend is down and all orders on the short side may be considered. If already holding short positions, look to take partial profits on any retracement to $59.89. Traders with remaining short positions, after profit taking, should consider placing capital conserving stops in the region of $59.89. Be prepared for a potential short term price rally back to the $57.16 area.
- Suggested placement of capital conserving stops:
- If Long, exit all contracts at: $51.05
- If Short, exit all contracts at: $59.89
(2.a) Additional WEEKLY chart info:
- Overall, the bias in prices is: Downwards.
- Short term: Prices are moving.
- Intermediate term: Prices are trending.
- Note: this chart shows extraordinary price action to the downside.
(2.b) WEEKLY chart price projection ranges (7/24/2017 – 7/28/2017):
- Note (2.b.1): prices are vulnerable to a correction towards $58.54.
- The upper projected target is: $60.13.
- The lower projected target is: $47.22.
- The projected closing price is: $53.68.
- Note (2.b.2): the above WEEKLY chart price projection ranges are for reference only, and can be easily exceeded by Mr. & Ms. Fickle Markets.
- ———————–
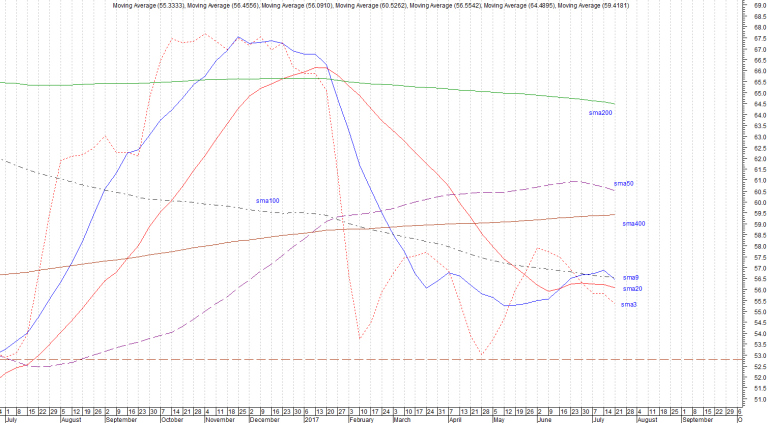
Chart 4: Qualcomm (QCOM), Weekly, EOD Close, Simple Moving Averages: sma3, sma9, sma20, sma50, sma100, sma200, sma400 … looking for moving average trends and crossovers
- ———————–
(2.c) WEEKLY Qualcomm chart Moving Averages
- The 3 period Simple Moving Average (sma3) at 55.33 is in a down trend.
- The 9 period Simple Moving Average (sma9) at 56.46 is in a down trend.
- The 20 period Simple Moving Average (sma20) at 56.09 is in a down trend.
- The 50 period Simple Moving Average (sma50) at 60.53 is in a down trend.
- The 100 period Simple Moving Average (sma100) at 56.55 is in a down trend.
- The 200 period Simple Moving Average (sma200) at 64.49 is in a down trend.
- The 400 period Simple Moving Average (sma400) at 59.42 is in an up trend.
- ———————–
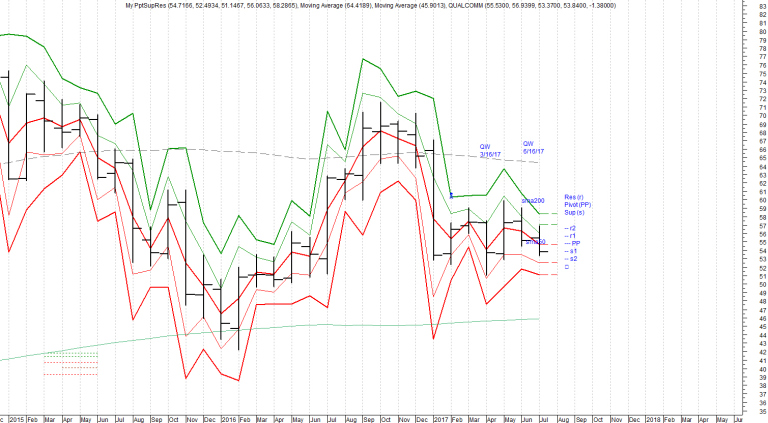
Chart 5: Qualcomm (QCOM), Monthly, EOD, O-H-L-C w/Resistances (r2, r1), Pivot Point (PP), and Supports (s1, s2).
- ———————–
(3) Analysis of MONTHLY chart activity through Friday’s (7/21/2017) close at $53.84
The current trend is down and all orders on the short side may be considered. If already holding short positions, we would look to take partial profits on any retracement to $70.24. Traders with remaining short positions, after profit taking, should consider placing capital conserving stops in the region of $71.62. Be prepared for a potential short term price pull back to the $61.12 area.
- Suggested placement of capital conserving stops:
- If Long, exit all contracts at: $50.13
- If Short, exit all contracts at: $71.62
(3.a) Additional MONTHLY chart info:
- Overall, the bias in prices is: Downwards.
- Short term: Prices are moving.
- Intermediate term: Prices are trending.
- Note (3.a.1): this chart shows extraordinary price action to the downside.
(3.b) MONTHLY chart price projection ranges (7/3/2017 – 7/31/2017):
- The upper projected target is: $67.35.
- The lower projected target is: $39.94.
- The projected closing price is: $53.65.
- Note (3.b.1): the above MONTHLY chart price projection ranges are for reference only, and can be easily exceeded, up or down, by Mr. & Ms. Fickle Markets.
— Monday, 6/12/2017 thru Friday, 6/30/2017 ——
-
-
- Thoughts on Brexit
- U. S. government Overseas Assassination 101
- The Cowardly Bombings in Brussels
- The Eleventh Sector for 2016: Real Estate
- Qualcomm (QCOM) (d-w-m) for Monday (6/12/2017)
- Qualcomm (QCOM) (d-w-m) for Monday (6/5/2017)
- Index Support and Resistance for Monday (5/8/2017)
- Index Support and Resistance for Monday (5/1/2017)
( x) All Links can be opened in a new tab or new window …
- ( xi ) I will be returning and adding more related chart info including links to charts with daily, weekly, and monthly (d-w-m) and percentage change charts analysis
Please read:
(1) Research and Investing Disclaimer
(2) Investing and Trading
[ More Blogs ]
-
Hope the above Qualcomm (QCOM) (d-w-m) calculations for July 24th 2017, day, week, and month of July… help your investing and trading planning today …
Advertisements Share this: