It is possible to look at a published example which demonstrates the method. The example is drawn from a description of a method used at the Oxford Institute for Retail Management to estimate (ante post) potential revenues at the Meadowhall shopping centre using a combination of geodemographics and spatial analysis based on comparisons to Gateshead’s Metro Centre, a shopping centre of a similar type, which had been opened in the mid-1970s (OXIRM 1990).
Geodemographic data relating to the Meadowhall and Metro Centre catchments are shown in the following table. The population is split into four 15-minute drive time bands around each centre. For brevity of exposition, the data are only shown for the first two bands (0-15 minutes, and 15-30 minutes) in the table; the equivalent data for the other two bands (30-45 minutes and over 45 minutes) are suppressed. Within each band, it is possible to divide the population into thirteen different geodemographic types. This analysis uses the PiN system produced by Pinpoint Analysis. The PiN types are represented by the twelve letters (A-L) shown in column 1 of the table. Column 2 of the table shows the number of households in the appropriate drive time band around Meadowhall which are of the given geodemographic type. Column 3 shows the number of households in each PiN type between the two centres, and column 5 gives an estimate of the amount of revenue which is generated at the Metro Centre from each PiN type within each drive time band. When we multiply columns 4 and 5 together, we can obtain an estimate of the amount of revenue which we expect Meadowhall to generate from each PiN type within each drive time band based on known performance of the Metro Centre. These estimates are shown in column 6 of the following table.
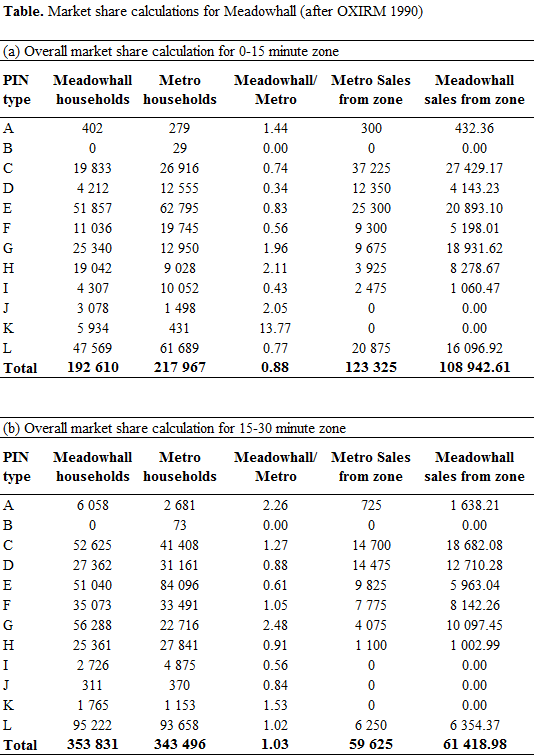
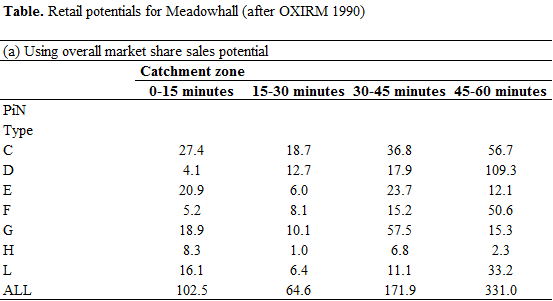
The revenue estimates produced in column 6 of the table now need to be summed up to give an estimate of the total revenue to be generated at Meadowhall. These calculations are shown for convenience. The bottom line of the table shows that we can anticipate an unadjusted revenue of £670 million using this method.