Published January 12, 2018
With the global economy firing on all cylinders it’s hard to believe investors would find anything to worry about. But they have. For years now investors have wondered when and how the era of near-zero interest rates would end. Are we now on the cusp of seeing how the backside of the Fed’s unprecedented monetary policy easing impacts markets? There are substantive signs in recent weeks of a potential shift in the landscape toward the “normalization” of interest rates. This week, for the first time in years, the 10-year U.S. Treasury yield rose to the upper boundary of the channel it has bounced around in for decades.
Chart 1: 10-year Treasury yield rises to the upper boundary of a long-term channel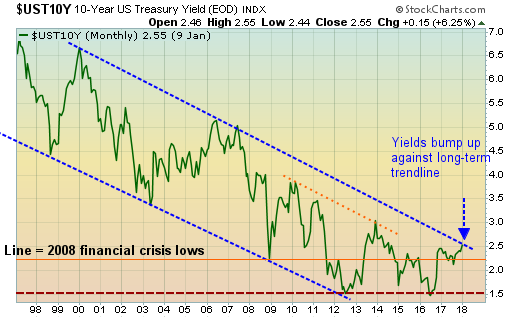
Breaking above this long-term channel is to be expected. The Fed remains in the early stages of reversing an era of ultra-low interest rates. The Fed is seen attempting to return rates to more normal levels as the domestic economy has put together several years of growth and now appears to be accelerating that growth, with strength in the global economy fueling the acceleration. Inflation has remained subdued but recently has shown signs of pushing above the Fed’s 2% target. It should be noted that interest rates remain barely above levels seen at the worst of the financial crisis. So we are not talking about rates being elevated at all, just a reversal out of a very, very long-term downtrend.
The expectation of ramping inflation and interest rates has damaged the more interest rate sensitive sectors of the stock market. The circle on Chart 2 below highlights the recent hits taken in real estate and utilities.
Chart 2: Rising interest rates break the uptrends for real estate and utilities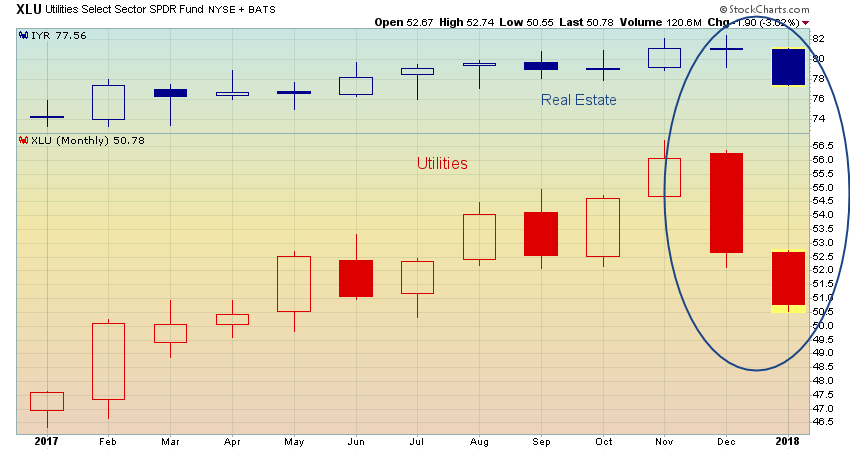
The real fear for investors would occur if interest rates “invert” where short-term rates are higher than longer-term rates. An inverting yield curve signals that investors do not believe economic growth will be high enough to justify the rise in short-term interest rates. Short-term rates are largely driven by the Federal Reserve policy. So as the Fed raises rates, the short-term rates respond by also rising. However, long-term rates are influenced by expectations for economic growth and inflation. Ideally, the long-term rates rise in concert with short-term rates as economic growth expectations increase with the uptick in interest rates. Below (Chart 3) we show how the spread in yield between short-term (2-year) rates and longer-term (10-year) rates has narrowed substantially. Two-year U.S. Treasury rates are the line at the bottom of the chart in red. The 10-year U.S. Treasury yield is in blue. While interest rates bounce around quite a bit, the trend higher in the red line is unmistakable while the blue line has not shown a similar advance as yet.
Chart 3: The yield spread between short-term and long-term bonds compresses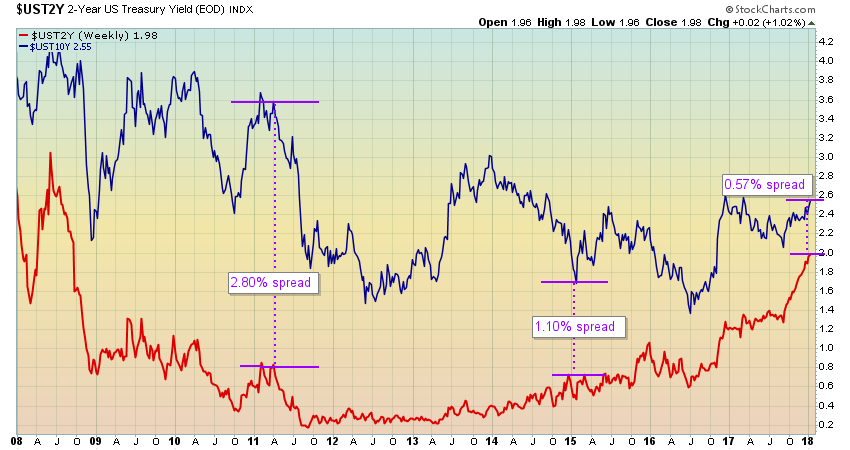
Why do investors care if yields invert where short-term rates exceed long-term rates? Because that inversion in the yield curve has been a very good predictor of a recession. Chart 4 below shows the yield spread between 2 and 10-year U.S. Treasury yields. The gray bars represent periods of recession, where economic growth is contracting. We’ve noted with red tick marks where the yield spread has gone below zero – e.g. short-term yield rise above long-term yields and the yield curve inverts. You can see that a red tick mark leads to recession quite consistently. It doesn’t occur immediately, and might take a year or more for the recession to appear. Nevertheless, investors are well aware of this relationship and will likely sell stocks heavily if an inverted yield curve appears. There will initially be some commentary about how this time is different and the yield curve might well normalize for a time. But the forces causing the inversion typically win out and the recession takes hold.
Chart 4: Yield spread between 2 and 10-year US Treasury yields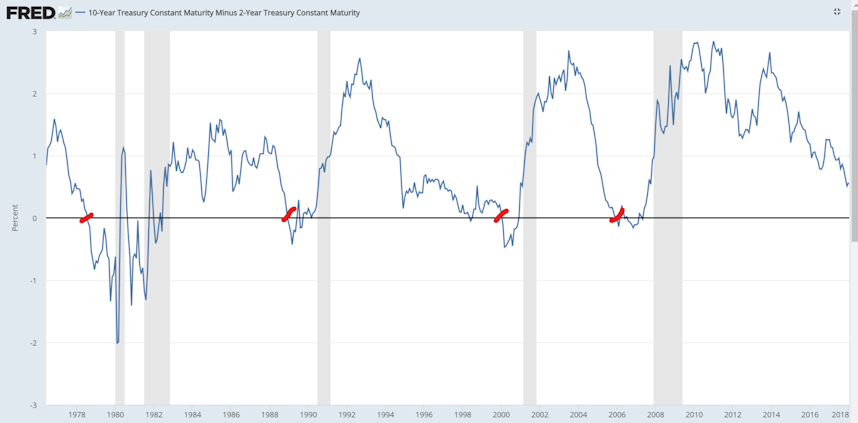
What will bring this bull market to an end? An inverted yield curve is one answer to that question. Yield spreads have compressed significantly over the past month or so leading to selling in interest-rate sensitive sectors. If the spreads continue to squeeze tighter, expect the stock market to begin struggling. Our models are always poised for that weakness to push us out of the stock market, preserving the bulk of our gains, and setting us up to profit from a march downward, should it occur.
Market UpdateInvestors continued to love 2018 as money poured into stocks in the second week of the new year. Monday offered little in the way of news and market action with stocks posting a +0.2% rise. Not all that long ago “brick and mortar” retailers were almost left for dead, presumed victims of Amazon’s dominance. Tuesday brought a reminder that some will survive and thrive. Target (TGT) raised earnings guidance leading retail stocks to push higher. The broad market held to a +0.1% lift. The year’s winning streak came to an end Wednesday, but ever so slightly so with a -0.1% dip. A sharp rally in energy stocks boosted the market Thursday to a +0.7% gain. Oil prices have hiked almost +10% in the past month. Retailers again showed strength as did Dow Industrial heavyweights Caterpillar (CAT) and Boeing (BA). The small-cap Russell 2000 played a little catch-up on the day soaring +1.7%. Bank earnings were the news of the day Friday with reports “noisy” due to companies taking one-time write-downs on the impact of tax reform. While the tax reform impact on banks near-term is negative, it is believed that the banks will more than recover those near-term write-downs over time. Thus, bank stocks performed mostly well on the day with JP Morgan (JPM) and Bank of America (BAC) both extending their 10%+ gains since late November. The much-watched inflation report came in a bit higher than expected but had no discernible effect on interest rates in Friday’s trade.
Stocks continued a near-perfect 2018 with 8 of 9 winning days for most major market averages through the first two weeks of the year. The S&P 500 (SPY) added +1.65% while the Nasdaq 100 (QQQ) rose +1.59%. Small-cap stocks (IWM) found a little more favor with a +2.16% increase for the week.
Warm wishes and until next week.
Share this:


