Education policy is increasingly being led by ‘big data’. Yet how valuable and useful is this data? An argument for ‘critical data literacy’.
Last week, a rare event occurred in the British media: a good news story about education. Press reports suggested that nine- and ten-year-olds in England had continued to rise up the rankings in a leading international league table of reading skills, The Progress in International Reading Literacy Study (PIRLS). Compared with the frequent stories that lament Britain’s poor showing in the international PISA tests, and its dismal position in scales of children’s ‘wellbeing’, this might have seemed like cause for celebration.
The government – in the form of much-loved Schools Minister Nick Gibb – promptly claimed that the rise was due to its insistence on schools adopting a teaching method called synthetic phonics, which relies on the recognition of decontextualised letter combinations.
Other commentators, however, expressed a need for caution. The rise in England’s overall scores was quite modest, and there was no evidence at all that the improvement was due to the teaching of phonics. In fact, a much more striking improvement had occurred before the government mandated phonics as the required method.
Others pointed out that, in the same tests, England was the lowest ranking English-speaking country for pupils showing enjoyment of reading, and second-lowest for engagement with reading. Of course, the study doesn’t tell us whether this is a consequence of the government’s preferred method of teaching reading, although it’s a possibility that would be worth considering.
There’s clearly a debate to be had here about the value of phonics: if you want to read Nick Gibb and Michael Rosen going head-to-head on this, click here. Most experts would suggest that this debate is not a matter of either/or. As readers, we obviously need to recognize letter combinations, but we also need to look for meaning – and (horror of horrors) even for pleasure. If children don’t enjoy reading, there’s not much likelihood of them doing it of their own accord – however highly they may score on a test.

However, my main concern here is about the value of data – and specifically ‘big data’ of the kind represented by the PIRLS and PISA tests. In this respect, the debate about the interpretation of these results shows up some very familiar problems.
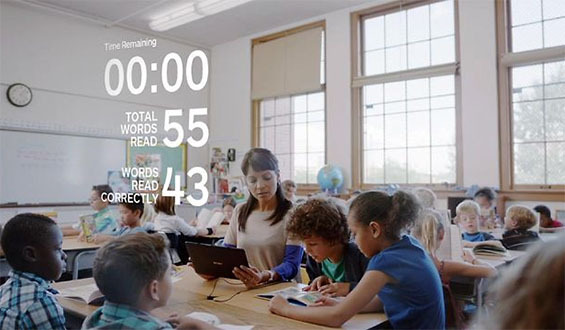
Firstly, there is the question of what such data purport to be measuring. Reading is a complex, multi-faceted activity: it’s by no means clear that when we assess ‘reading’ we are necessarily assessing the full range of practices or abilities involved. For example, phonics is essentially about accurate word recognition; whereas the PIRLS tests are actually about reading comprehension. The two are related, but they aren’t the same, and achievement in one area doesn’t necessarily tell you anything about the other.
Furthermore, some of these aspects are much more easily measured than others. We can easily test whether or not children can sound out combinations of letters on a flash card, but comprehension is much more difficult to measure, at least if we want to avoid being reductive. (Those of us who recall doing ‘comprehension passages’ in their English lessons will know that such tests are easy to pass without any comprehension necessarily taking place at all.)
Secondly, Gibb’s remarks raise the obvious issue of correlation and causality. There may be many possible reasons why reading skills are rising or falling relative to other countries; but until you have identified and somehow ‘controlled’ or accounted for those factors in your analysis, there is no way that you can reliably conclude that A causes B, or indeed vice-versa. Here too, some of these factors may be much more amenable to measurement and quantification than others.
Third, there is the question of what anybody might do with this information. If we find that children in England have risen from tenth to eighth place (as in this case), what follows from that? Or if, as is more often the case, we find they have slipped downwards, what do we do as a result? Few of us are in a position to move to Finland or Singapore, where children seemingly score better; although for wealthy parents, there is always the option of private tutoring.
However, the government’s response often seems to be that we should make our education system more like that of Singapore – although interestingly they seem less inclined to learn from Finland, where teaching methods are generally much more progressive and enlightened than they are here. But to suggest that we might improve test scores by simply importing particular teaching methods from elsewhere is to ignore the enormous social, cultural and institutional differences between countries.
As with school league tables, the logic of these international comparisons seems to be inexorable. If we want to do better, then we need to be more effective in teaching whatever it is that the tests are testing. As ever, it would seem that what counts in education is what can be counted. The imperative of testing comes to determine the content and method of teaching.

These are well-established debates, but they take on a new urgency in the light of growing calls for education to become more ‘data-driven’ or ‘evidence based’. I’ll come at these issues in a different way in another post, following shortly. But there are some fundamental questions we need to ask here about what we mean by ‘data’ and ‘evidence’.
The term ‘data’ derives from Latin: it’s a plural term, suggesting things that are simply given. Yet whether they work with qualitative or quantitative data, researchers all know that data are not given but actively constructed by the methods we use and the questions we ask. The kind of data we get, how we interpret that data, and how valuable or useful it is, all depend upon human choice and intervention.
Likewise, in the use of the term ‘evidence’, there’s often an assumption that truth is something obvious and visible to the naked eye (again, it’s in the Latin). Evidence, it seems, it just out there in the world, waiting to be seen. All we need to do is gather it, like picking apples from a tree, and then weigh it up. If we have enough good apples (rather than rotten ones), then we have truth. While this approach might work in some fields – for example, in medicine – it is almost impossible to sustain in education, where the phenomena we are observing are so messy and so complicated.

There’s been a fair amount of talk recently about the idea of ‘data literacy’, both in business and in education. In practice, this often seems to be regarded as a purely technical issue – a matter of handling, processing and presenting numerical data. In an age of big data, where large amounts of digital information are so easily accessible, these are clearly important issues.
However, I would argue that we need another form of data literacy here – an ability to read data critically, and to ask questions about how it is constructed, interpreted and used by different parties. As with the PIRLS story, we frequently encounter this data via the media – and what we encounter is largely based on press releases and (if we’re lucky) the executive summaries of large technical reports that even journalists themselves are unlikely to read. When we start to look beyond the headlines, what we find is often more complex and more diverse than the media coverage suggests. In fact, there are a great many interesting conclusions in the PIRLS report – and a great many angles that journalists might have chosen to pursue – some of which are potentially much less comfortable for government.
And so, predictably enough, I would see data literacy as an important dimension of media literacy. Joel Best’s work on the media reporting and political use of statistics – for example in this book – is a really accessible starting point here. If, as critics increasingly claim, our lives are coming to be ruled by the imperatives of data, it’s vital that we understand what’s going on, and develop the ability to speak back.
Related


