NOAA Teacher at Sea
Samantha Adams
Aboard NOAA Ship Hi’ialakai
July 25 – August 3, 2017
Mission: Woods Hole Oceanographic Institution (WHOI) Hawaii Ocean Time-series Station deployment (WHOTS-14)
Geographic Area of Cruise: Hawaii, Pacific Ocean
Date: Saturday, 29 July 2017
Weather Data from the Bridge:
Latitude & Longitude: 22o 45’N, 157o 56’W. Ship speed: 1.3 knots. Air temperature: 27.8oC. Sea temperature: 27.0oC. Humidity: 72%.Wind speed: 14 knots. Wind direction: 107 degrees. Sky cover: Few.
Science and Technology Log:
The most difficult part of Thursday’s buoy deployment was making sure the anchor was dropped on target. Throughout the day, shifting winds and currents kept pushing the ship away from the anchor’s target location. There was constant communication between the ship’s crew and the science team, correcting for this, but while everyone thought we were close when the anchor was dropped, nobody knew for sure until the anchor’s actual location had been surveyed.
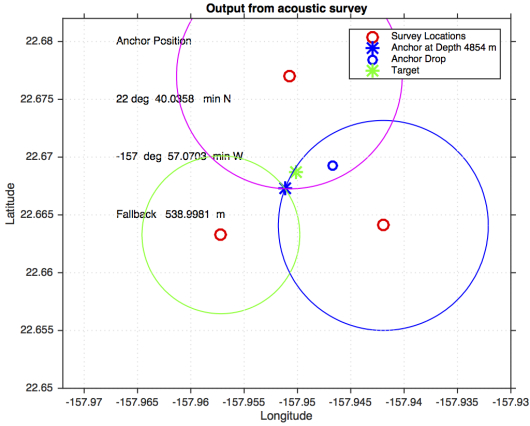
Triangulation of the WHOTS-14 buoy’s anchor location. Look at how close the ‘Anchor at Depth’ location is to the ‘Target’ location — only 177.7 meters apart! Also notice that all three circles intersect at one point, meaning that the triangulated location of the anchor is quite accurate.
To survey the anchor site, the ship “pinged” (sent a signal to) the acoustic releases on the buoy’s mooring line from three separate locations around the area where the anchor was dropped. This determines the distance from the ship to the anchor — or, more accurately, the distance from the ship to the acoustic releases. When all three distances are plotted (see the map above), the exact location of the buoy’s anchor can be determined. Success! The buoy’s anchor is 177.7 meters away from the target location — closer to the intended target than any other WHOTS deployment has gotten.
After deployment on Thursday, and all day Friday, the Hi’ialakai stayed “on station” about a quarter of a nautical mile downwind of the WHOTS-14 buoy, in order to verify that the instruments on the buoy were making accurate measurements. Because both meteorological and oceanographic measurements are being made, the buoy’s data must be verified by two different methods.
Weather data from the buoy (air temperature, relative humidity, wind speed, etc.) is verified using measurements from the Hi’ialakai’s own weather station and a separate set of instruments from NOAA’s Environmental Sciences Research Laboratory. This process is relatively simple, only requiring a few quick mouse clicks (to download the data), a flashdrive (to transfer the data), and a “please” and “thank you”.

July 28, 2017, 5:58PM HAST. Preparing the rosette for a CDT cast. Notice that the grey sampling bottles are open. If you look closely, you can see clear plastic “wire” running from the top of the sampling bottles to the center of the rosette. The wires are fastened on hooks which, when triggered by the computer in the lab, flip up, releasing the wire and closing the sampling bottle.
Salinity, temperature and depth measurements (from the MicroCats on the mooring line), on the other hand, are much more difficult to verify. In order to get the necessary “in situ” oceanographic data (from measurements made close to the buoy), the water must be sampled directly. This is done buy doing something called a CTD cast — in this case, a specific type called a yo-yo.
The contraption in the picture to the left is called a rosette. It consists of a PCV pipe frame, several grey sampling bottles around the outside of the frame, and multiple sets of instruments in the center (one primary and one backup) for each measurement being made.

July 28, 2017, 6:21PM HAST. On station at WHOTS-14, about halfway through a CDT cast (which typically take an hour). The cable that raises and lowers the rosette is running through the pulley in the upper right hand corner of the photo. The buoy is just visible in the distance, under the yellow arm.
The rosette is hooked to a stainless steel cable, hoisted over the side of the ship, and lowered into the water. Cable is cast (run out) until the rosette reaches a certain depth — which can be anything, really, depending on what measurements need to be made. For most of the verification measurements, this depth has been 250 meters. Then, the rosette is hauled up to the surface. And lowered back down. And raised up to the surface. And lowered back down. It’s easy to see why it’s called a yo-yo! (CDT casts that go deeper — thousands of meters instead of hundreds — only go down and up once.)
For the verification process, the rosette is raised and lowered five times, with the instruments continuously measuring temperature, salinity and depth. On the final trip back to the surface, the sampling bottles are closed remotely, one at a time, at specific depths, by a computer in the ship’s lab. (The sampling depths are determined during the cast, by identifying points of interest in the data. Typically, water is sampled at the lowest point of the cast and five meters below the surface, as well as where the salinity and oxygen content of the water is at its lowest.) Then, the rosette is hauled back on board, and water from the sampling bottles is emptied into smaller glass bottles, to be taken back to shore and more closely analyzed.
On this research cruise, the yo-yos are being done by scientists and student researchers from the University of Hawaii, who routinely work at the ALOHA site (where the WHOTS buoys are anchored). The yoyos are done at regular intervals throughout the day, with the first cast beginning at about 6AM HAST and the final one wrapping up at about midnight.

July 29, 2017, 9:43AM HAST. On station at WHOTS-13. One CDT cast has already been completed; another is scheduled to begin in about 15 minutes.
After the final yo-yo was complete at the WHOTS-14 buoy early Saturday morning, the Hi’ialakai traveled to the WHOTS-13 buoy. Today and tomorrow (Sunday), more in situ meteorological and oceanographic verification measurements will be made at the WHOTS-13 site. All of this — the meteorological measurements, the yo-yos, the days rocking back and forth on the ocean swell — must happen in order to make sure that the data being recorded is consistent from one buoy to the next. If this is the case, then it’s a good bet that any trends or changes in the data are real — caused by the environmental conditions — rather than differences in the instruments themselves.
Personal Log:
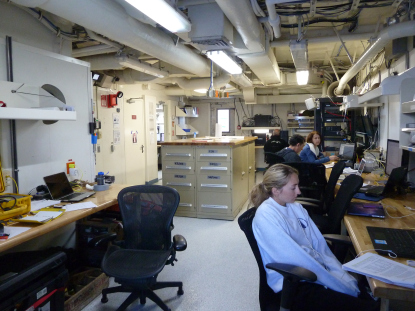
The Hi’ialakai’s dry lab. Everyone is wearing either a sweatshirt or a jacket… are we sure this is Hawaii?
Most of the science team’s time is divided between the Hi’ialakai’s deck and the labs (there are two; one wet, and one dry). The wet lab contains stainless steel sinks, countertops, and an industrial freezer; on research cruises that focus on marine biology, samples can be stored there. Since the only samples being collected on this cruise are water, which don’t need to be frozen, the freezer was turned off before we left port, and turned into additional storage space. The dry lab (shown in the picture above) is essentially open office space, in use nearly 24 hours a day. The labs, like most living areas on the ship, are quite well air conditioned. It may be hot and humid outside, but inside, hoodies and hot coffee are both at a premium!
Did You Know?
The acronym “CTD” stands for conductivity, temperature and depth. But the MicroCats on the buoy mooring lines and the CTD casts are supposed to measure salinity, temperature and depth… so where does conductivity come in? It turns out that the salinity of the water can’t be measured directly — but conductivity of the water can.
When salt is dissolved into water, it breaks into ions, which have positive and negative charges. In order to determine salinity, an instrument measuring conductivity will pass a small electrical current between two electrodes (conductors), and the voltage on either side of the electrodes is measured. Ions facilitate the flow of the electrical current through the water. Therefore conductivity, with the temperature of the water taken into account, can be used to determine the salinity.
Share this: