Climate data, including rainfall and temperature, are important for studying climate and water issues in an area. A major issue with doing research in the Middle East is getting access to reliable and complete data. In this blog I’ve talked about access to, and quality of, data, in posts like “Your guide to the “data jungle”: A summary of the data I have used or reviewed in my research” and Looking for GIS data for Iraq/Kurdistan?.
Many researchers solve the problem with finding meteorological data from stations by using gridded global data, such as the Climate Research Unit (CRU) dataset, or the Global Precipitation Climatology Centre (GPCC) dataset. I’ve written about the problem with coverage of the CRU before, but here is a more thorough visual demonstration of the problem that I think researchers should be aware of when using the data for climate research in the Middle East. CRU is based on interpolation of data from climate stations, which basically means that the precipitation values are modeled for grid cells that do not have a station. If the station is far away, the estimation will be more difficult.
Currently, there is a great interest to understand the drought in Syria, and it’s socio-economic effects, and many of the studies use CRU as a data source.
Here I’ve downloaded the precipitation station count in each cell for every ten years between 1910 and 2010, from the IRI data library. I decided to use the data available for January each year, but any other month would have given a similar (if not the same) result. As expected, the number of stations is low in this area in 1910 and 1920, but in 1940 the amount of stations starts to increase.
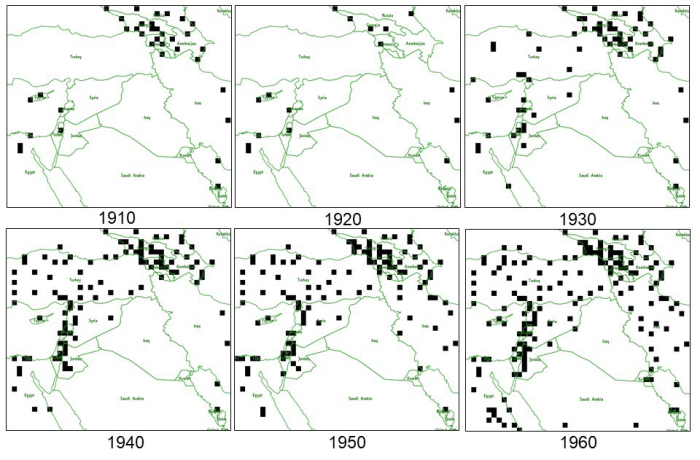
Climate station (recording precipitation) count for CRU v. 3.21. Black cells represent 1 or more climate station within the grid cell.
From 1970 to 1990 thee are many stations available, especially in Turkey and along the Mediterranean coast, but in Syria and Iraq the number of stations remain low. In 2000 the number of stations available had decreased, and the CRU dataset is relying on way fewer stations than in the 1990s. For both 2000 and 2010, there are only 5 climate stations inside Syria.
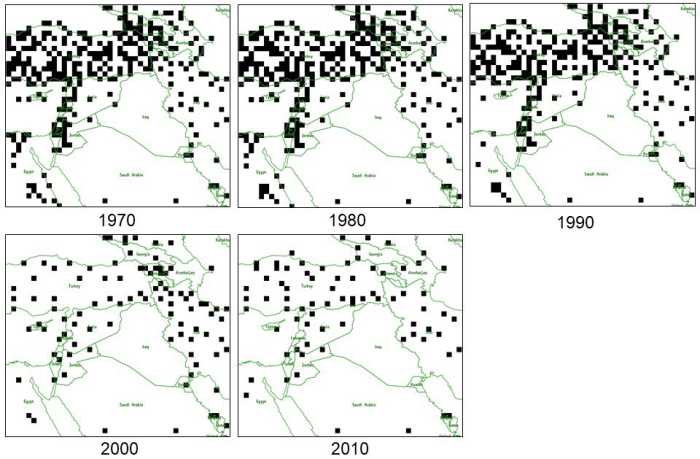
Climate station (recording precipitation) count for CRU v. 3.21. Black cells represent 1 or more climate station within the grid cell.
An important question here is what happened to all the stations? Why did so many stations in the area stop reporting or become unavailable in 2000? Furthermore, I wonder how this affects the reliability of the dataset, especially for uses in Syria and Iraq. Do the interpolations reflect the actual climatology of the region?
What happens when claims about the Syrian drought and its severity are based on data with large gaps in between stations? A major conclusion from my research paper on drought in Northern Iraq was the importance of triangulating data in order to avoid data problems and misleading results. This should probably be considered when using CRU in Iraq and Syria as well.
Advertisements Share this: